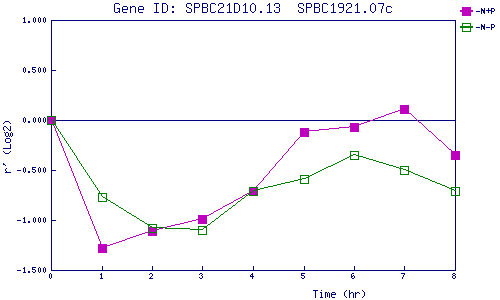
| 0 | 1 | 2 | 3 | 4 | 5 | 6 | 7 | 8 | |
| -N+P | 0.000 | -1.275 | -1.108 | -0.990 | -0.709 | -0.119 | -0.072 | 0.112 | -0.349 |
| -N-P | 0.000 | -0.773 | -1.075 | -1.105 | -0.709 | -0.594 | -0.350 | -0.504 | -0.713 |
|
-N+P: Nitrogen starved in the presence of P-factor -N-P: Nitrogen starved in the absence of P-factor |