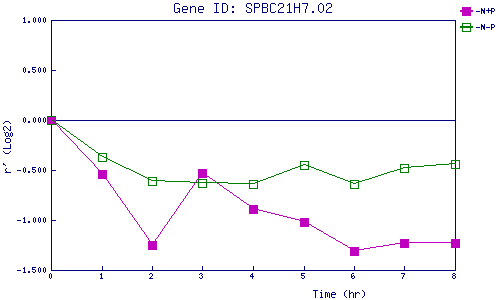
| 0 | 1 | 2 | 3 | 4 | 5 | 6 | 7 | 8 | |
| -N+P | 0.000 | -0.544 | -1.248 | -0.527 | -0.888 | -1.020 | -1.311 | -1.233 | -1.231 |
| -N-P | 0.000 | -0.367 | -0.606 | -0.627 | -0.639 | -0.454 | -0.643 | -0.477 | -0.445 |
|
-N+P: Nitrogen starved in the presence of P-factor -N-P: Nitrogen starved in the absence of P-factor |