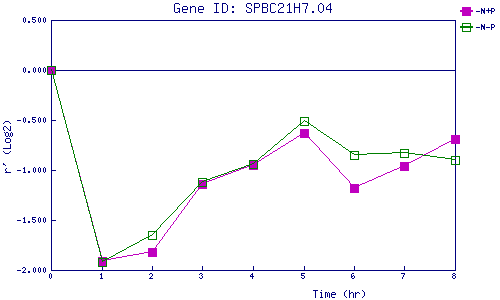
| 0 | 1 | 2 | 3 | 4 | 5 | 6 | 7 | 8 | |
| -N+P | 0.000 | -1.909 | -1.820 | -1.139 | -0.946 | -0.626 | -1.183 | -0.965 | -0.687 |
| -N-P | 0.000 | -1.924 | -1.650 | -1.117 | -0.936 | -0.512 | -0.851 | -0.826 | -0.899 |
|
-N+P: Nitrogen starved in the presence of P-factor -N-P: Nitrogen starved in the absence of P-factor |