sfc6
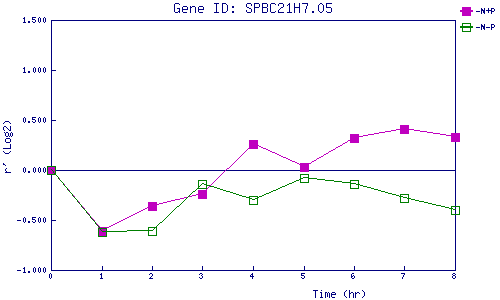
| 0 | 1 | 2 | 3 | 4 | 5 | 6 | 7 | 8 | |
| -N+P | 0.000 | -0.606 | -0.362 | -0.238 | 0.261 | 0.031 | 0.316 | 0.409 | 0.333 |
| -N-P | 0.000 | -0.621 | -0.613 | -0.136 | -0.296 | -0.079 | -0.143 | -0.276 | -0.395 |
|
-N+P: Nitrogen starved in the presence of P-factor -N-P: Nitrogen starved in the absence of P-factor |