his5
| 0 | 1 | 2 | 3 | 4 | 5 | 6 | 7 | 8 | |
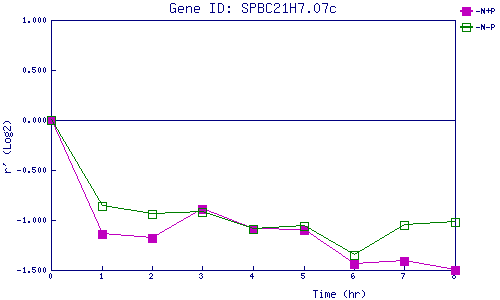
| -N+P | 0.000 | -1.138 | -1.182 | -0.886 | -1.089 | -1.097 | -1.444 | -1.410 | -1.496 |
| -N-P | 0.000 | -0.857 | -0.939 | -0.923 | -1.087 | -1.064 | -1.348 | -1.048 | -1.022 |
|
-N+P: Nitrogen starved in the presence of P-factor -N-P: Nitrogen starved in the absence of P-factor |
