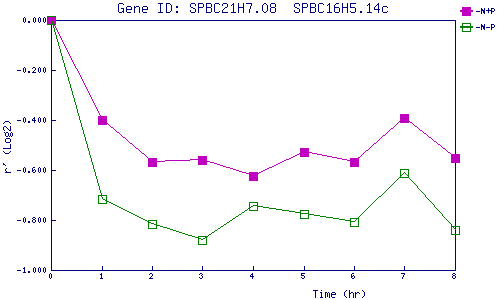
| 0 | 1 | 2 | 3 | 4 | 5 | 6 | 7 | 8 | |
| -N+P | 0.000 | -0.400 | -0.569 | -0.560 | -0.624 | -0.530 | -0.567 | -0.391 | -0.550 |
| -N-P | 0.000 | -0.716 | -0.815 | -0.881 | -0.742 | -0.775 | -0.806 | -0.613 | -0.841 |
|
-N+P: Nitrogen starved in the presence of P-factor -N-P: Nitrogen starved in the absence of P-factor |