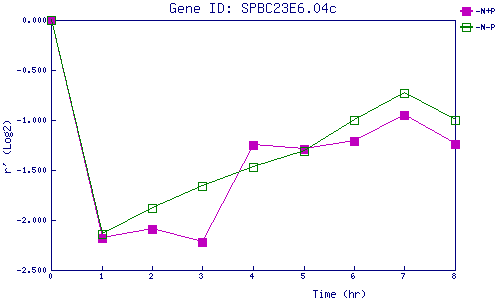
| 0 | 1 | 2 | 3 | 4 | 5 | 6 | 7 | 8 | |
| -N+P | 0.000 | -2.182 | -2.090 | -2.225 | -1.252 | -1.288 | -1.208 | -0.949 | -1.236 |
| -N-P | 0.000 | -2.141 | -1.884 | -1.665 | -1.467 | -1.306 | -0.996 | -0.732 | -1.004 |
|
-N+P: Nitrogen starved in the presence of P-factor -N-P: Nitrogen starved in the absence of P-factor |