| 0 | 1 | 2 | 3 | 4 | 5 | 6 | 7 | 8 | |
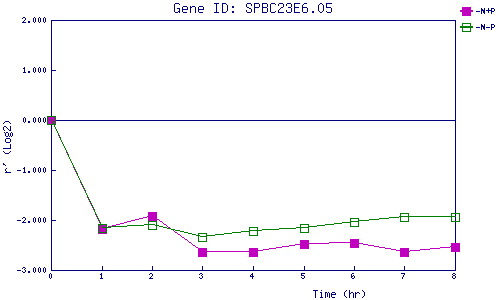
| -N+P | 0.000 | -2.189 | -1.916 | -2.640 | -2.648 | -2.480 | -2.451 | -2.630 | -2.539 |
| -N-P | 0.000 | -2.169 | -2.096 | -2.336 | -2.219 | -2.161 | -2.033 | -1.936 | -1.941 |
|
-N+P: Nitrogen starved in the presence of P-factor -N-P: Nitrogen starved in the absence of P-factor |