rfc1
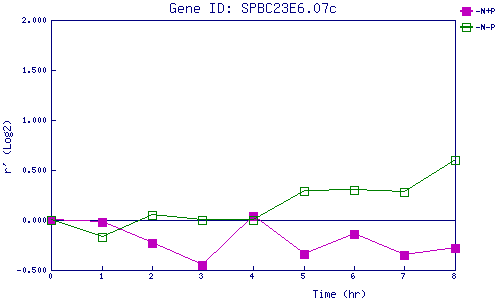
| 0 | 1 | 2 | 3 | 4 | 5 | 6 | 7 | 8 | |
| -N+P | 0.000 | -0.016 | -0.234 | -0.449 | 0.041 | -0.342 | -0.138 | -0.350 | -0.284 |
| -N-P | 0.000 | -0.168 | 0.048 | 0.003 | -0.004 | 0.293 | 0.302 | 0.279 | 0.603 |
|
-N+P: Nitrogen starved in the presence of P-factor -N-P: Nitrogen starved in the absence of P-factor |