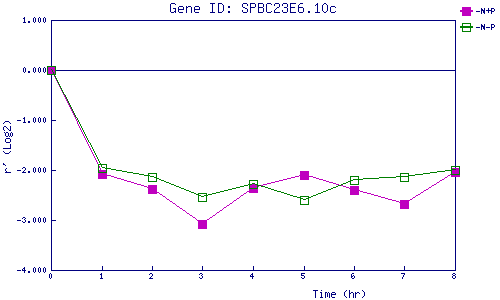
| 0 | 1 | 2 | 3 | 4 | 5 | 6 | 7 | 8 | |
| -N+P | 0.000 | -2.072 | -2.384 | -3.081 | -2.351 | -2.104 | -2.401 | -2.685 | -2.047 |
| -N-P | 0.000 | -1.959 | -2.140 | -2.539 | -2.288 | -2.609 | -2.205 | -2.136 | -2.010 |
|
-N+P: Nitrogen starved in the presence of P-factor -N-P: Nitrogen starved in the absence of P-factor |