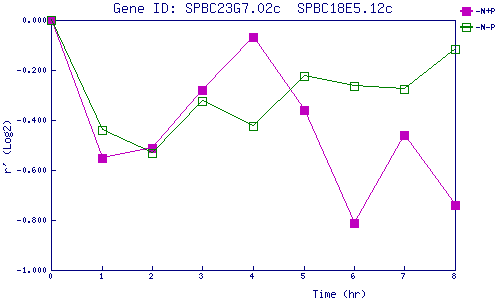
| 0 | 1 | 2 | 3 | 4 | 5 | 6 | 7 | 8 | |
| -N+P | 0.000 | -0.550 | -0.510 | -0.281 | -0.069 | -0.358 | -0.812 | -0.459 | -0.740 |
| -N-P | 0.000 | -0.441 | -0.532 | -0.324 | -0.424 | -0.226 | -0.266 | -0.277 | -0.117 |
|
-N+P: Nitrogen starved in the presence of P-factor -N-P: Nitrogen starved in the absence of P-factor |