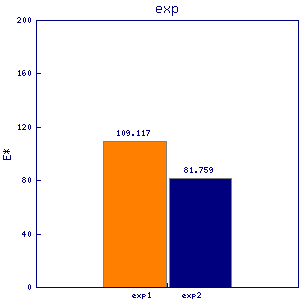
sui1 psu1
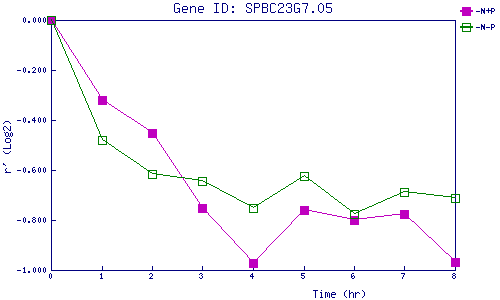
| 0 | 1 | 2 | 3 | 4 | 5 | 6 | 7 | 8 | |
| -N+P | 0.000 | -0.322 | -0.451 | -0.752 | -0.972 | -0.761 | -0.799 | -0.778 | -0.968 |
| -N-P | 0.000 | -0.479 | -0.617 | -0.645 | -0.754 | -0.624 | -0.775 | -0.689 | -0.713 |
|
-N+P: Nitrogen starved in the presence of P-factor -N-P: Nitrogen starved in the absence of P-factor |