| 0 | 1 | 2 | 3 | 4 | 5 | 6 | 7 | 8 | |
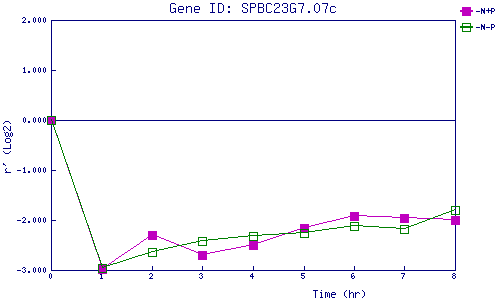
| -N+P | 0.000 | -2.975 | -2.304 | -2.708 | -2.495 | -2.160 | -1.922 | -1.969 | -1.995 |
| -N-P | 0.000 | -2.954 | -2.641 | -2.426 | -2.328 | -2.266 | -2.122 | -2.181 | -1.797 |
|
-N+P: Nitrogen starved in the presence of P-factor -N-P: Nitrogen starved in the absence of P-factor |