rpp202 rpp2-2
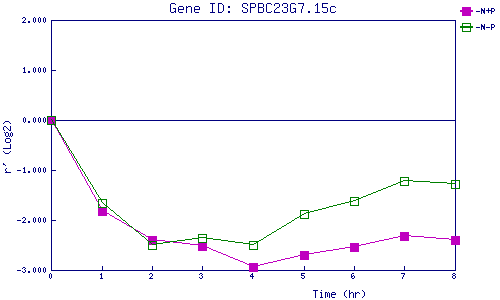
| 0 | 1 | 2 | 3 | 4 | 5 | 6 | 7 | 8 | |
| -N+P | 0.000 | -1.828 | -2.396 | -2.524 | -2.942 | -2.691 | -2.536 | -2.316 | -2.393 |
| -N-P | 0.000 | -1.657 | -2.491 | -2.363 | -2.504 | -1.870 | -1.615 | -1.213 | -1.277 |
|
-N+P: Nitrogen starved in the presence of P-factor -N-P: Nitrogen starved in the absence of P-factor |