sid4
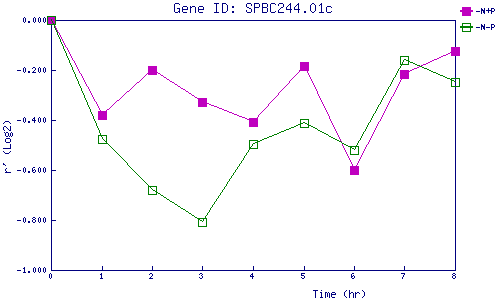
| 0 | 1 | 2 | 3 | 4 | 5 | 6 | 7 | 8 | |
| -N+P | 0.000 | -0.380 | -0.202 | -0.328 | -0.409 | -0.186 | -0.601 | -0.216 | -0.123 |
| -N-P | 0.000 | -0.477 | -0.680 | -0.807 | -0.494 | -0.413 | -0.519 | -0.162 | -0.250 |
|
-N+P: Nitrogen starved in the presence of P-factor -N-P: Nitrogen starved in the absence of P-factor |