| 0 | 1 | 2 | 3 | 4 | 5 | 6 | 7 | 8 | |
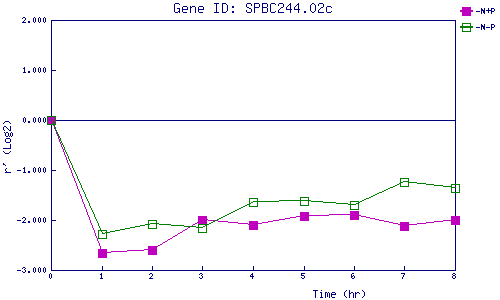
| -N+P | 0.000 | -2.668 | -2.601 | -2.009 | -2.104 | -1.924 | -1.904 | -2.122 | -1.990 |
| -N-P | 0.000 | -2.279 | -2.073 | -2.152 | -1.631 | -1.612 | -1.708 | -1.235 | -1.355 |
|
-N+P: Nitrogen starved in the presence of P-factor -N-P: Nitrogen starved in the absence of P-factor |