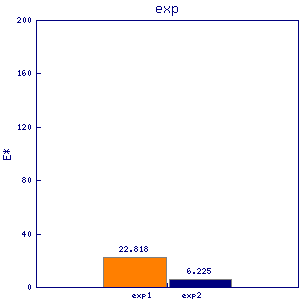
ubl1 ned8
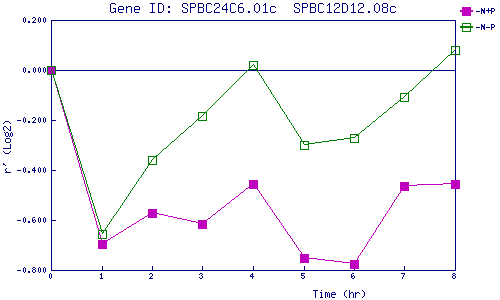
| 0 | 1 | 2 | 3 | 4 | 5 | 6 | 7 | 8 | |
| -N+P | 0.000 | -0.695 | -0.573 | -0.614 | -0.454 | -0.754 | -0.778 | -0.463 | -0.456 |
| -N-P | 0.000 | -0.657 | -0.362 | -0.182 | 0.021 | -0.300 | -0.272 | -0.108 | 0.080 |
|
-N+P: Nitrogen starved in the presence of P-factor -N-P: Nitrogen starved in the absence of P-factor |