| 0 | 1 | 2 | 3 | 4 | 5 | 6 | 7 | 8 | |
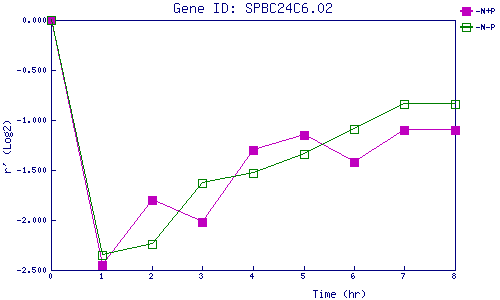
| -N+P | 0.000 | -2.450 | -1.805 | -2.020 | -1.300 | -1.154 | -1.425 | -1.099 | -1.095 |
| -N-P | 0.000 | -2.346 | -2.236 | -1.630 | -1.531 | -1.338 | -1.087 | -0.837 | -0.845 |
|
-N+P: Nitrogen starved in the presence of P-factor -N-P: Nitrogen starved in the absence of P-factor |