| 0 | 1 | 2 | 3 | 4 | 5 | 6 | 7 | 8 | |
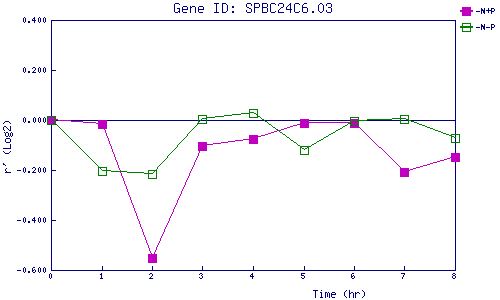
| -N+P | 0.000 | -0.016 | -0.553 | -0.102 | -0.076 | -0.012 | -0.011 | -0.210 | -0.149 |
| -N-P | 0.000 | -0.203 | -0.216 | 0.004 | 0.029 | -0.118 | -0.004 | 0.003 | -0.073 |
|
-N+P: Nitrogen starved in the presence of P-factor -N-P: Nitrogen starved in the absence of P-factor |