sec28
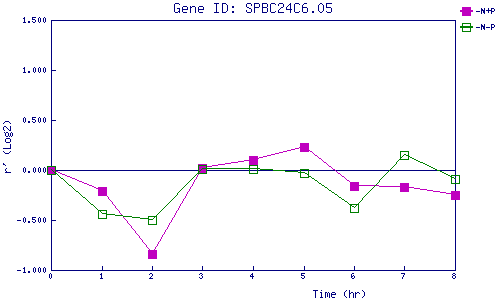
| 0 | 1 | 2 | 3 | 4 | 5 | 6 | 7 | 8 | |
| -N+P | 0.000 | -0.208 | -0.836 | 0.019 | 0.103 | 0.228 | -0.161 | -0.174 | -0.253 |
| -N-P | 0.000 | -0.440 | -0.504 | 0.007 | 0.010 | -0.032 | -0.380 | 0.152 | -0.086 |
|
-N+P: Nitrogen starved in the presence of P-factor -N-P: Nitrogen starved in the absence of P-factor |