cwf14
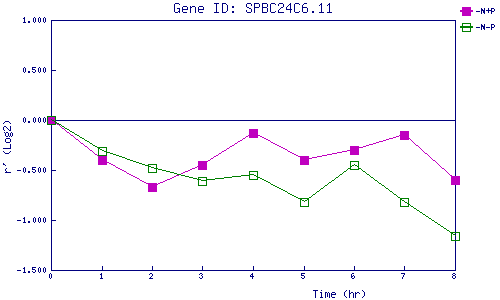
| 0 | 1 | 2 | 3 | 4 | 5 | 6 | 7 | 8 | |
| -N+P | 0.000 | -0.401 | -0.671 | -0.450 | -0.128 | -0.398 | -0.295 | -0.154 | -0.600 |
| -N-P | 0.000 | -0.310 | -0.478 | -0.613 | -0.550 | -0.821 | -0.454 | -0.818 | -1.163 |
|
-N+P: Nitrogen starved in the presence of P-factor -N-P: Nitrogen starved in the absence of P-factor |