mis3
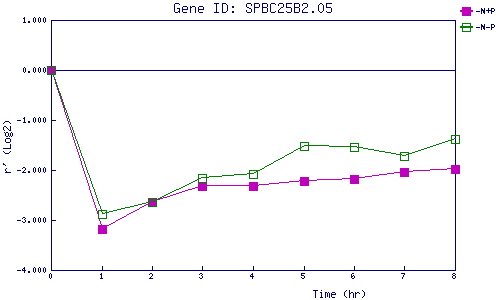
| 0 | 1 | 2 | 3 | 4 | 5 | 6 | 7 | 8 | |
| -N+P | 0.000 | -3.181 | -2.646 | -2.318 | -2.315 | -2.221 | -2.172 | -2.050 | -1.984 |
| -N-P | 0.000 | -2.886 | -2.632 | -2.151 | -2.089 | -1.530 | -1.544 | -1.728 | -1.374 |
|
-N+P: Nitrogen starved in the presence of P-factor -N-P: Nitrogen starved in the absence of P-factor |