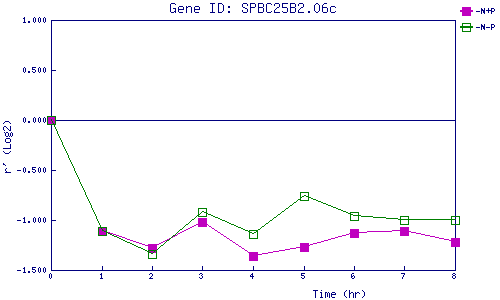
| 0 | 1 | 2 | 3 | 4 | 5 | 6 | 7 | 8 | |
| -N+P | 0.000 | -1.112 | -1.280 | -1.023 | -1.361 | -1.271 | -1.129 | -1.106 | -1.220 |
| -N-P | 0.000 | -1.114 | -1.344 | -0.925 | -1.143 | -0.758 | -0.963 | -1.000 | -1.001 |
|
-N+P: Nitrogen starved in the presence of P-factor -N-P: Nitrogen starved in the absence of P-factor |