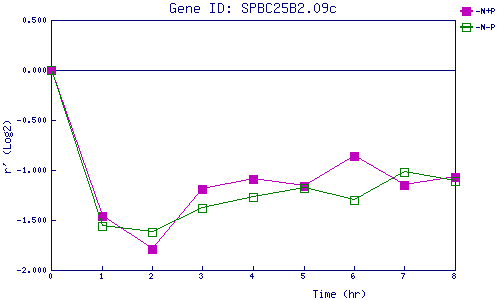
| 0 | 1 | 2 | 3 | 4 | 5 | 6 | 7 | 8 | |
| -N+P | 0.000 | -1.463 | -1.786 | -1.194 | -1.086 | -1.164 | -0.855 | -1.153 | -1.073 |
| -N-P | 0.000 | -1.560 | -1.622 | -1.381 | -1.270 | -1.181 | -1.300 | -1.025 | -1.114 |
|
-N+P: Nitrogen starved in the presence of P-factor -N-P: Nitrogen starved in the absence of P-factor |