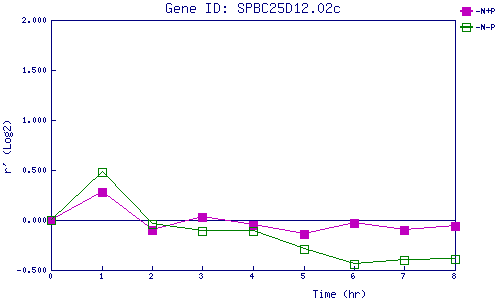
| 0 | 1 | 2 | 3 | 4 | 5 | 6 | 7 | 8 | |
| -N+P | 0.000 | 0.279 | -0.103 | 0.034 | -0.052 | -0.140 | -0.032 | -0.097 | -0.058 |
| -N-P | 0.000 | 0.479 | -0.041 | -0.109 | -0.112 | -0.293 | -0.437 | -0.399 | -0.393 |
|
-N+P: Nitrogen starved in the presence of P-factor -N-P: Nitrogen starved in the absence of P-factor |