mcm7
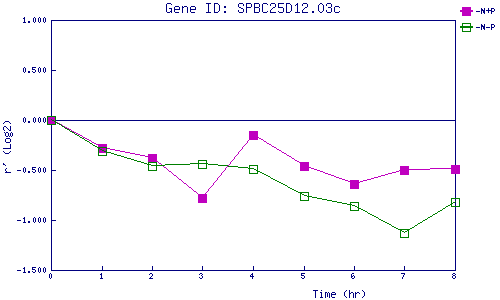
| 0 | 1 | 2 | 3 | 4 | 5 | 6 | 7 | 8 | |
| -N+P | 0.000 | -0.278 | -0.380 | -0.775 | -0.146 | -0.461 | -0.643 | -0.504 | -0.491 |
| -N-P | 0.000 | -0.313 | -0.462 | -0.440 | -0.494 | -0.756 | -0.861 | -1.126 | -0.820 |
|
-N+P: Nitrogen starved in the presence of P-factor -N-P: Nitrogen starved in the absence of P-factor |