trm1
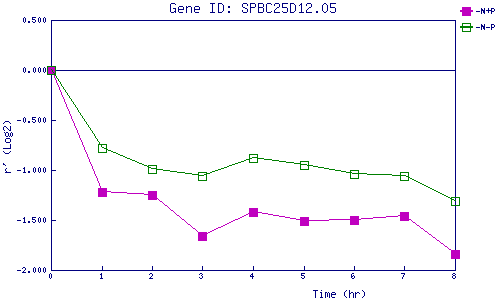
| 0 | 1 | 2 | 3 | 4 | 5 | 6 | 7 | 8 | |
| -N+P | 0.000 | -1.225 | -1.249 | -1.662 | -1.417 | -1.510 | -1.500 | -1.465 | -1.841 |
| -N-P | 0.000 | -0.785 | -0.989 | -1.058 | -0.881 | -0.949 | -1.041 | -1.056 | -1.313 |
|
-N+P: Nitrogen starved in the presence of P-factor -N-P: Nitrogen starved in the absence of P-factor |