| 0 | 1 | 2 | 3 | 4 | 5 | 6 | 7 | 8 | |
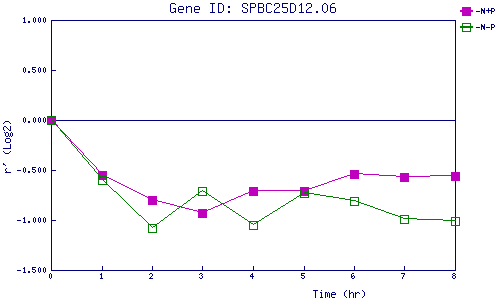
| -N+P | 0.000 | -0.548 | -0.795 | -0.934 | -0.707 | -0.706 | -0.536 | -0.568 | -0.564 |
| -N-P | 0.000 | -0.601 | -1.079 | -0.710 | -1.054 | -0.729 | -0.806 | -0.989 | -1.008 |
|
-N+P: Nitrogen starved in the presence of P-factor -N-P: Nitrogen starved in the absence of P-factor |