gar1
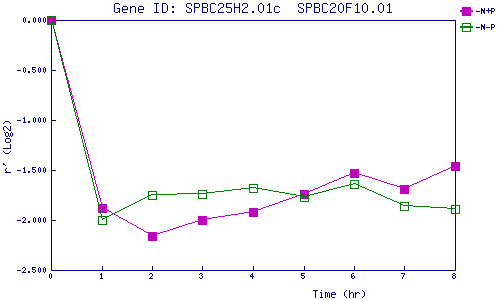
| 0 | 1 | 2 | 3 | 4 | 5 | 6 | 7 | 8 | |
| -N+P | 0.000 | -1.884 | -2.158 | -2.000 | -1.925 | -1.738 | -1.526 | -1.688 | -1.458 |
| -N-P | 0.000 | -2.005 | -1.750 | -1.739 | -1.684 | -1.768 | -1.635 | -1.865 | -1.890 |
|
-N+P: Nitrogen starved in the presence of P-factor -N-P: Nitrogen starved in the absence of P-factor |