ths1
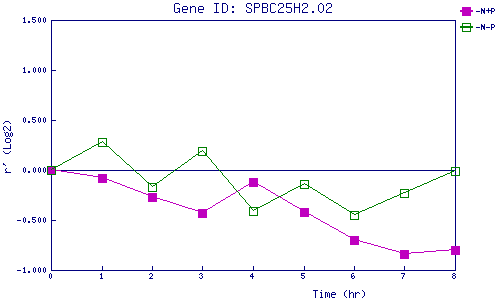
| 0 | 1 | 2 | 3 | 4 | 5 | 6 | 7 | 8 | |
| -N+P | 0.000 | -0.076 | -0.273 | -0.434 | -0.118 | -0.416 | -0.704 | -0.838 | -0.803 |
| -N-P | 0.000 | 0.281 | -0.171 | 0.187 | -0.410 | -0.144 | -0.451 | -0.234 | -0.013 |
|
-N+P: Nitrogen starved in the presence of P-factor -N-P: Nitrogen starved in the absence of P-factor |