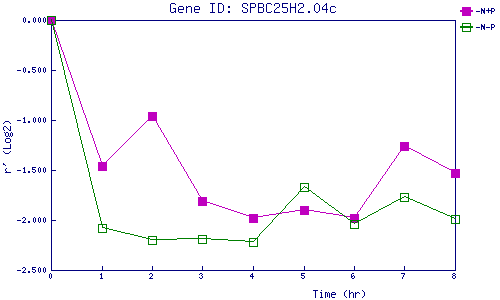
| 0 | 1 | 2 | 3 | 4 | 5 | 6 | 7 | 8 | |
| -N+P | 0.000 | -1.457 | -0.956 | -1.812 | -1.984 | -1.899 | -1.985 | -1.260 | -1.526 |
| -N-P | 0.000 | -2.076 | -2.196 | -2.188 | -2.218 | -1.668 | -2.043 | -1.768 | -1.993 |
|
-N+P: Nitrogen starved in the presence of P-factor -N-P: Nitrogen starved in the absence of P-factor |