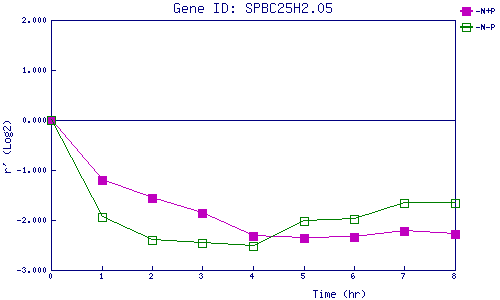
| 0 | 1 | 2 | 3 | 4 | 5 | 6 | 7 | 8 | |
| -N+P | 0.000 | -1.191 | -1.565 | -1.855 | -2.314 | -2.356 | -2.343 | -2.217 | -2.279 |
| -N-P | 0.000 | -1.937 | -2.397 | -2.457 | -2.524 | -2.025 | -1.971 | -1.661 | -1.656 |
|
-N+P: Nitrogen starved in the presence of P-factor -N-P: Nitrogen starved in the absence of P-factor |