reserved_name_hrf1
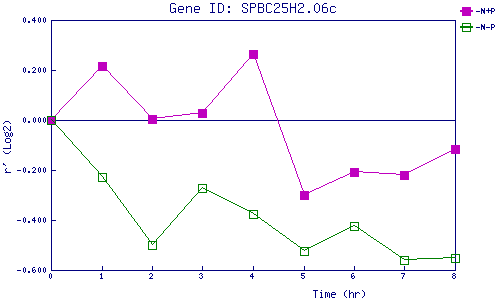
| 0 | 1 | 2 | 3 | 4 | 5 | 6 | 7 | 8 | |
| -N+P | 0.000 | 0.217 | 0.005 | 0.029 | 0.262 | -0.301 | -0.206 | -0.221 | -0.116 |
| -N-P | 0.000 | -0.228 | -0.499 | -0.272 | -0.377 | -0.523 | -0.422 | -0.558 | -0.550 |
|
-N+P: Nitrogen starved in the presence of P-factor -N-P: Nitrogen starved in the absence of P-factor |