tif11
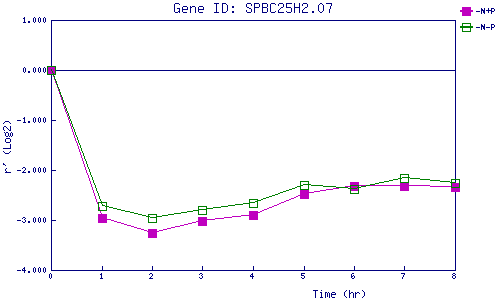
| 0 | 1 | 2 | 3 | 4 | 5 | 6 | 7 | 8 | |
| -N+P | 0.000 | -2.962 | -3.263 | -3.027 | -2.895 | -2.481 | -2.328 | -2.315 | -2.337 |
| -N-P | 0.000 | -2.714 | -2.958 | -2.790 | -2.660 | -2.306 | -2.376 | -2.161 | -2.267 |
|
-N+P: Nitrogen starved in the presence of P-factor -N-P: Nitrogen starved in the absence of P-factor |