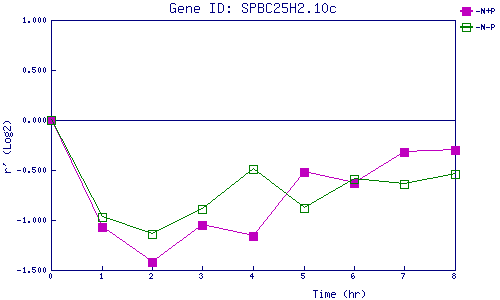
| 0 | 1 | 2 | 3 | 4 | 5 | 6 | 7 | 8 | |
| -N+P | 0.000 | -1.071 | -1.417 | -1.052 | -1.161 | -0.516 | -0.631 | -0.320 | -0.298 |
| -N-P | 0.000 | -0.967 | -1.135 | -0.890 | -0.490 | -0.875 | -0.593 | -0.637 | -0.541 |
|
-N+P: Nitrogen starved in the presence of P-factor -N-P: Nitrogen starved in the absence of P-factor |