cct7
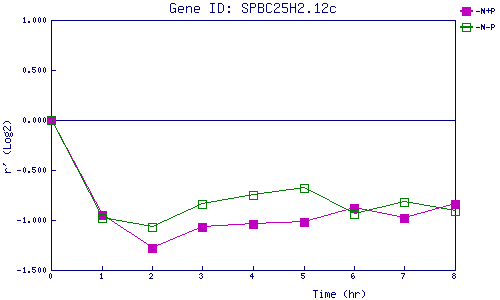
| 0 | 1 | 2 | 3 | 4 | 5 | 6 | 7 | 8 | |
| -N+P | 0.000 | -0.954 | -1.279 | -1.068 | -1.037 | -1.021 | -0.878 | -0.979 | -0.843 |
| -N-P | 0.000 | -0.977 | -1.066 | -0.841 | -0.752 | -0.680 | -0.941 | -0.823 | -0.909 |
|
-N+P: Nitrogen starved in the presence of P-factor -N-P: Nitrogen starved in the absence of P-factor |