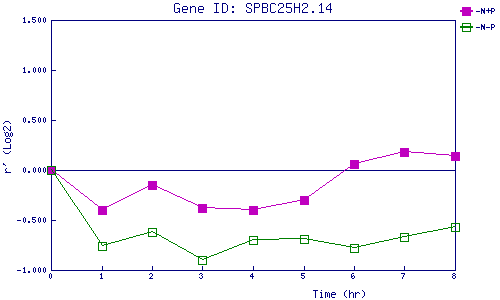
| 0 | 1 | 2 | 3 | 4 | 5 | 6 | 7 | 8 | |
| -N+P | 0.000 | -0.398 | -0.148 | -0.381 | -0.396 | -0.299 | 0.064 | 0.175 | 0.144 |
| -N-P | 0.000 | -0.759 | -0.624 | -0.903 | -0.705 | -0.686 | -0.780 | -0.669 | -0.566 |
|
-N+P: Nitrogen starved in the presence of P-factor -N-P: Nitrogen starved in the absence of P-factor |
