thi2 nmt2
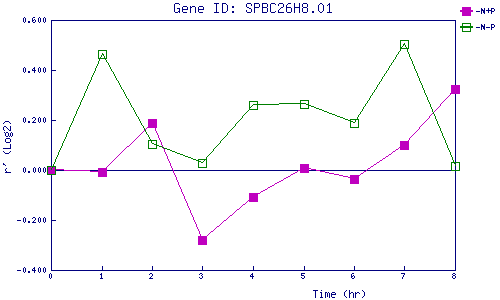
| 0 | 1 | 2 | 3 | 4 | 5 | 6 | 7 | 8 | |
| -N+P | 0.000 | -0.007 | 0.189 | -0.280 | -0.108 | 0.007 | -0.036 | 0.099 | 0.323 |
| -N-P | 0.000 | 0.466 | 0.103 | 0.028 | 0.260 | 0.264 | 0.189 | 0.505 | 0.016 |
|
-N+P: Nitrogen starved in the presence of P-factor -N-P: Nitrogen starved in the absence of P-factor |