sec9 Sp-snR68-sno
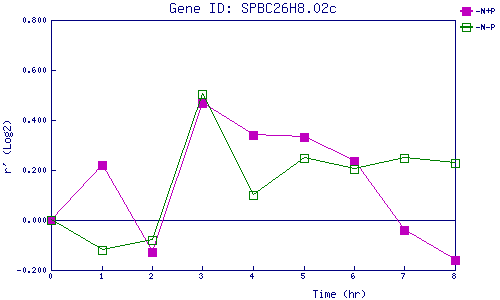
| 0 | 1 | 2 | 3 | 4 | 5 | 6 | 7 | 8 | |
| -N+P | 0.000 | 0.219 | -0.127 | 0.467 | 0.339 | 0.331 | 0.235 | -0.039 | -0.160 |
| -N-P | 0.000 | -0.119 | -0.080 | 0.504 | 0.101 | 0.250 | 0.205 | 0.249 | 0.228 |
|
-N+P: Nitrogen starved in the presence of P-factor -N-P: Nitrogen starved in the absence of P-factor |