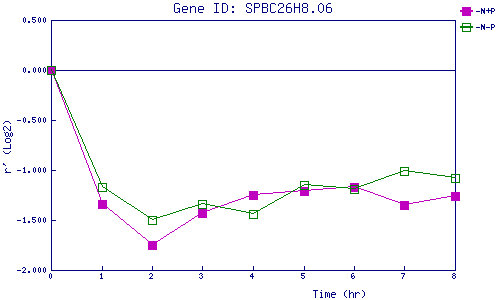
| 0 | 1 | 2 | 3 | 4 | 5 | 6 | 7 | 8 | |
| -N+P | 0.000 | -1.341 | -1.751 | -1.428 | -1.249 | -1.211 | -1.167 | -1.354 | -1.265 |
| -N-P | 0.000 | -1.173 | -1.505 | -1.342 | -1.440 | -1.146 | -1.194 | -1.008 | -1.085 |
|
-N+P: Nitrogen starved in the presence of P-factor -N-P: Nitrogen starved in the absence of P-factor |