nda3
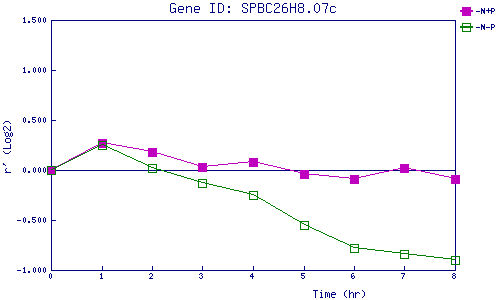
| 0 | 1 | 2 | 3 | 4 | 5 | 6 | 7 | 8 | |
| -N+P | 0.000 | 0.269 | 0.184 | 0.030 | 0.078 | -0.040 | -0.088 | 0.024 | -0.091 |
| -N-P | 0.000 | 0.249 | 0.018 | -0.133 | -0.250 | -0.546 | -0.779 | -0.843 | -0.895 |
|
-N+P: Nitrogen starved in the presence of P-factor -N-P: Nitrogen starved in the absence of P-factor |