| 0 | 1 | 2 | 3 | 4 | 5 | 6 | 7 | 8 | |
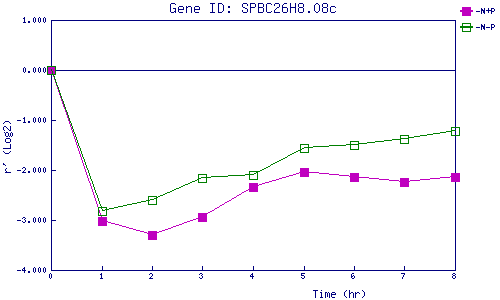
| -N+P | 0.000 | -3.012 | -3.293 | -2.938 | -2.342 | -2.035 | -2.131 | -2.233 | -2.132 |
| -N-P | 0.000 | -2.824 | -2.591 | -2.166 | -2.096 | -1.564 | -1.503 | -1.375 | -1.222 |
|
-N+P: Nitrogen starved in the presence of P-factor -N-P: Nitrogen starved in the absence of P-factor |