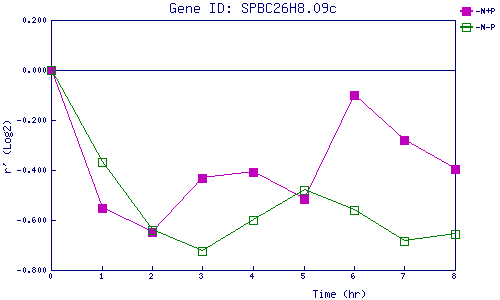
| 0 | 1 | 2 | 3 | 4 | 5 | 6 | 7 | 8 | |
| -N+P | 0.000 | -0.550 | -0.646 | -0.434 | -0.406 | -0.515 | -0.099 | -0.279 | -0.396 |
| -N-P | 0.000 | -0.368 | -0.639 | -0.724 | -0.598 | -0.482 | -0.559 | -0.684 | -0.654 |
|
-N+P: Nitrogen starved in the presence of P-factor -N-P: Nitrogen starved in the absence of P-factor |