dis3
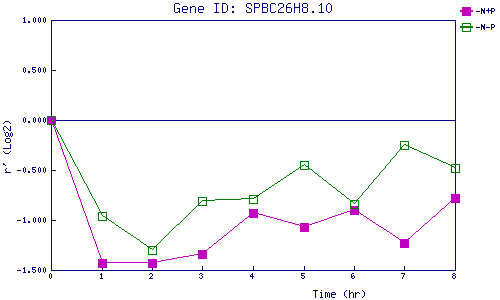
| 0 | 1 | 2 | 3 | 4 | 5 | 6 | 7 | 8 | |
| -N+P | 0.000 | -1.432 | -1.428 | -1.344 | -0.930 | -1.068 | -0.901 | -1.229 | -0.782 |
| -N-P | 0.000 | -0.960 | -1.301 | -0.814 | -0.793 | -0.452 | -0.839 | -0.251 | -0.485 |
|
-N+P: Nitrogen starved in the presence of P-factor -N-P: Nitrogen starved in the absence of P-factor |