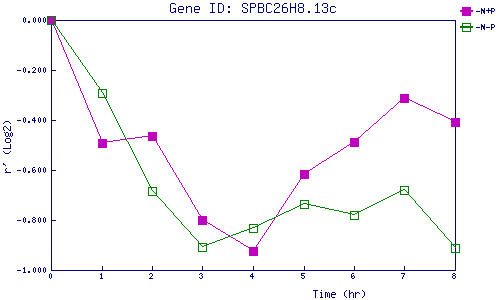
| 0 | 1 | 2 | 3 | 4 | 5 | 6 | 7 | 8 | |
| -N+P | 0.000 | -0.493 | -0.463 | -0.800 | -0.923 | -0.617 | -0.489 | -0.314 | -0.408 |
| -N-P | 0.000 | -0.292 | -0.685 | -0.909 | -0.830 | -0.736 | -0.780 | -0.678 | -0.914 |
|
-N+P: Nitrogen starved in the presence of P-factor -N-P: Nitrogen starved in the absence of P-factor |