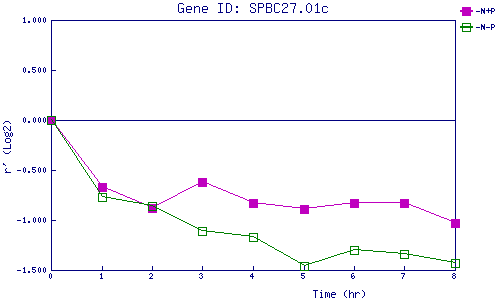
| 0 | 1 | 2 | 3 | 4 | 5 | 6 | 7 | 8 | |
| -N+P | 0.000 | -0.666 | -0.882 | -0.623 | -0.833 | -0.891 | -0.834 | -0.826 | -1.030 |
| -N-P | 0.000 | -0.769 | -0.865 | -1.107 | -1.174 | -1.460 | -1.304 | -1.339 | -1.432 |
|
-N+P: Nitrogen starved in the presence of P-factor -N-P: Nitrogen starved in the absence of P-factor |