meu25
| 0 | 1 | 2 | 3 | 4 | 5 | 6 | 7 | 8 | |
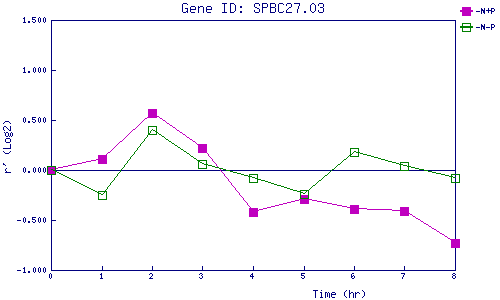
| -N+P | 0.000 | 0.106 | 0.573 | 0.224 | -0.417 | -0.288 | -0.388 | -0.414 | -0.730 |
| -N-P | 0.000 | -0.248 | 0.398 | 0.059 | -0.075 | -0.243 | 0.185 | 0.041 | -0.075 |
|
-N+P: Nitrogen starved in the presence of P-factor -N-P: Nitrogen starved in the absence of P-factor |
