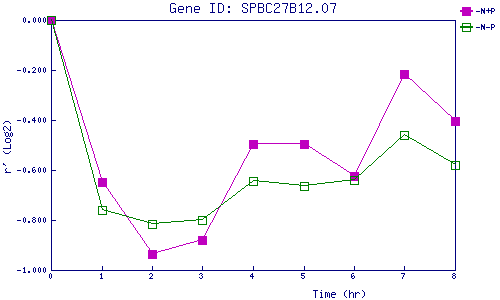
| 0 | 1 | 2 | 3 | 4 | 5 | 6 | 7 | 8 | |
| -N+P | 0.000 | -0.649 | -0.938 | -0.880 | -0.494 | -0.498 | -0.626 | -0.218 | -0.403 |
| -N-P | 0.000 | -0.759 | -0.818 | -0.801 | -0.645 | -0.663 | -0.640 | -0.459 | -0.579 |
|
-N+P: Nitrogen starved in the presence of P-factor -N-P: Nitrogen starved in the absence of P-factor |