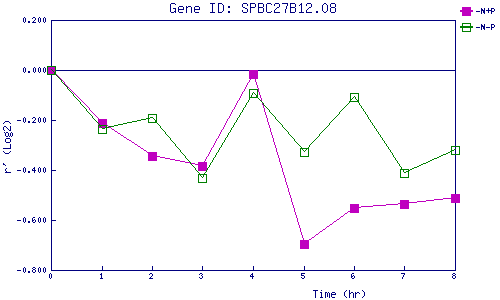
| 0 | 1 | 2 | 3 | 4 | 5 | 6 | 7 | 8 | |
| -N+P | 0.000 | -0.212 | -0.342 | -0.384 | -0.016 | -0.698 | -0.554 | -0.536 | -0.510 |
| -N-P | 0.000 | -0.237 | -0.193 | -0.434 | -0.093 | -0.327 | -0.107 | -0.413 | -0.322 |
|
-N+P: Nitrogen starved in the presence of P-factor -N-P: Nitrogen starved in the absence of P-factor |