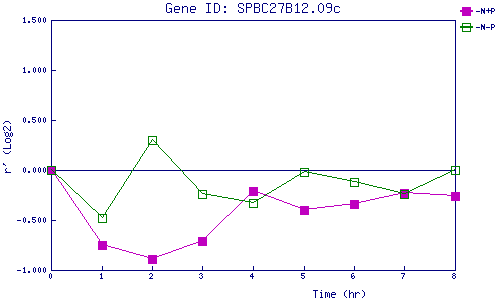
| 0 | 1 | 2 | 3 | 4 | 5 | 6 | 7 | 8 | |
| -N+P | 0.000 | -0.749 | -0.894 | -0.707 | -0.214 | -0.399 | -0.342 | -0.231 | -0.257 |
| -N-P | 0.000 | -0.485 | 0.297 | -0.237 | -0.327 | -0.023 | -0.122 | -0.235 | -0.003 |
|
-N+P: Nitrogen starved in the presence of P-factor -N-P: Nitrogen starved in the absence of P-factor |